

Vanity Metrics 2.0
Why Lovable's soaring revenues may be a case for vanity metrics 2.0 and what we should look at beyond mere top-line growth.

The term vanity metrics dates back to 2009 when Eric Ries juxtaposed them with actionable metrics.
"They might make you feel good, but they don't offer clear guidance for what to do."
His point was that we often use metrics that are easy to measure. We also tend to rely on those that show a more rosy picture. However, they don't necessarily impact the business's bottom line.
If no users pay for your product in any way, it doesn't much matter how many of them there are. And yes, I am aware of Facebook and Google, and statistically speaking, they're edge cases. And we'll get back to them.
Vanity Metrics 1.0
Eric Reis expanded the idea of vanity metrics in The Lean Startup. Examples of vanity metrics include:
Pageviews
Number of users
Number of followers
They demonstrate the product's popularity but fail to indicate the health of the business behind it.
Pageviews may not lead to sign-ups. And sign-ups, in turn, may not lead to recurring visits. Recurring visits mean little if they don't ultimately translate into purchases.
The original metric (pageviews) is thus so much disconnected from revenues that it's meaningless. However, it sure looks great when we can show how many more people click on the website.
On the opposite end, there are actionable metrics that have a laser focus on what's essential to the business—the bottom line.
Anything related to revenues, especially recurring revenues, retention, conversion rates, etc.
Each of these tells a story about whether we're measurably doing better than we did last month.
The Lovable Story
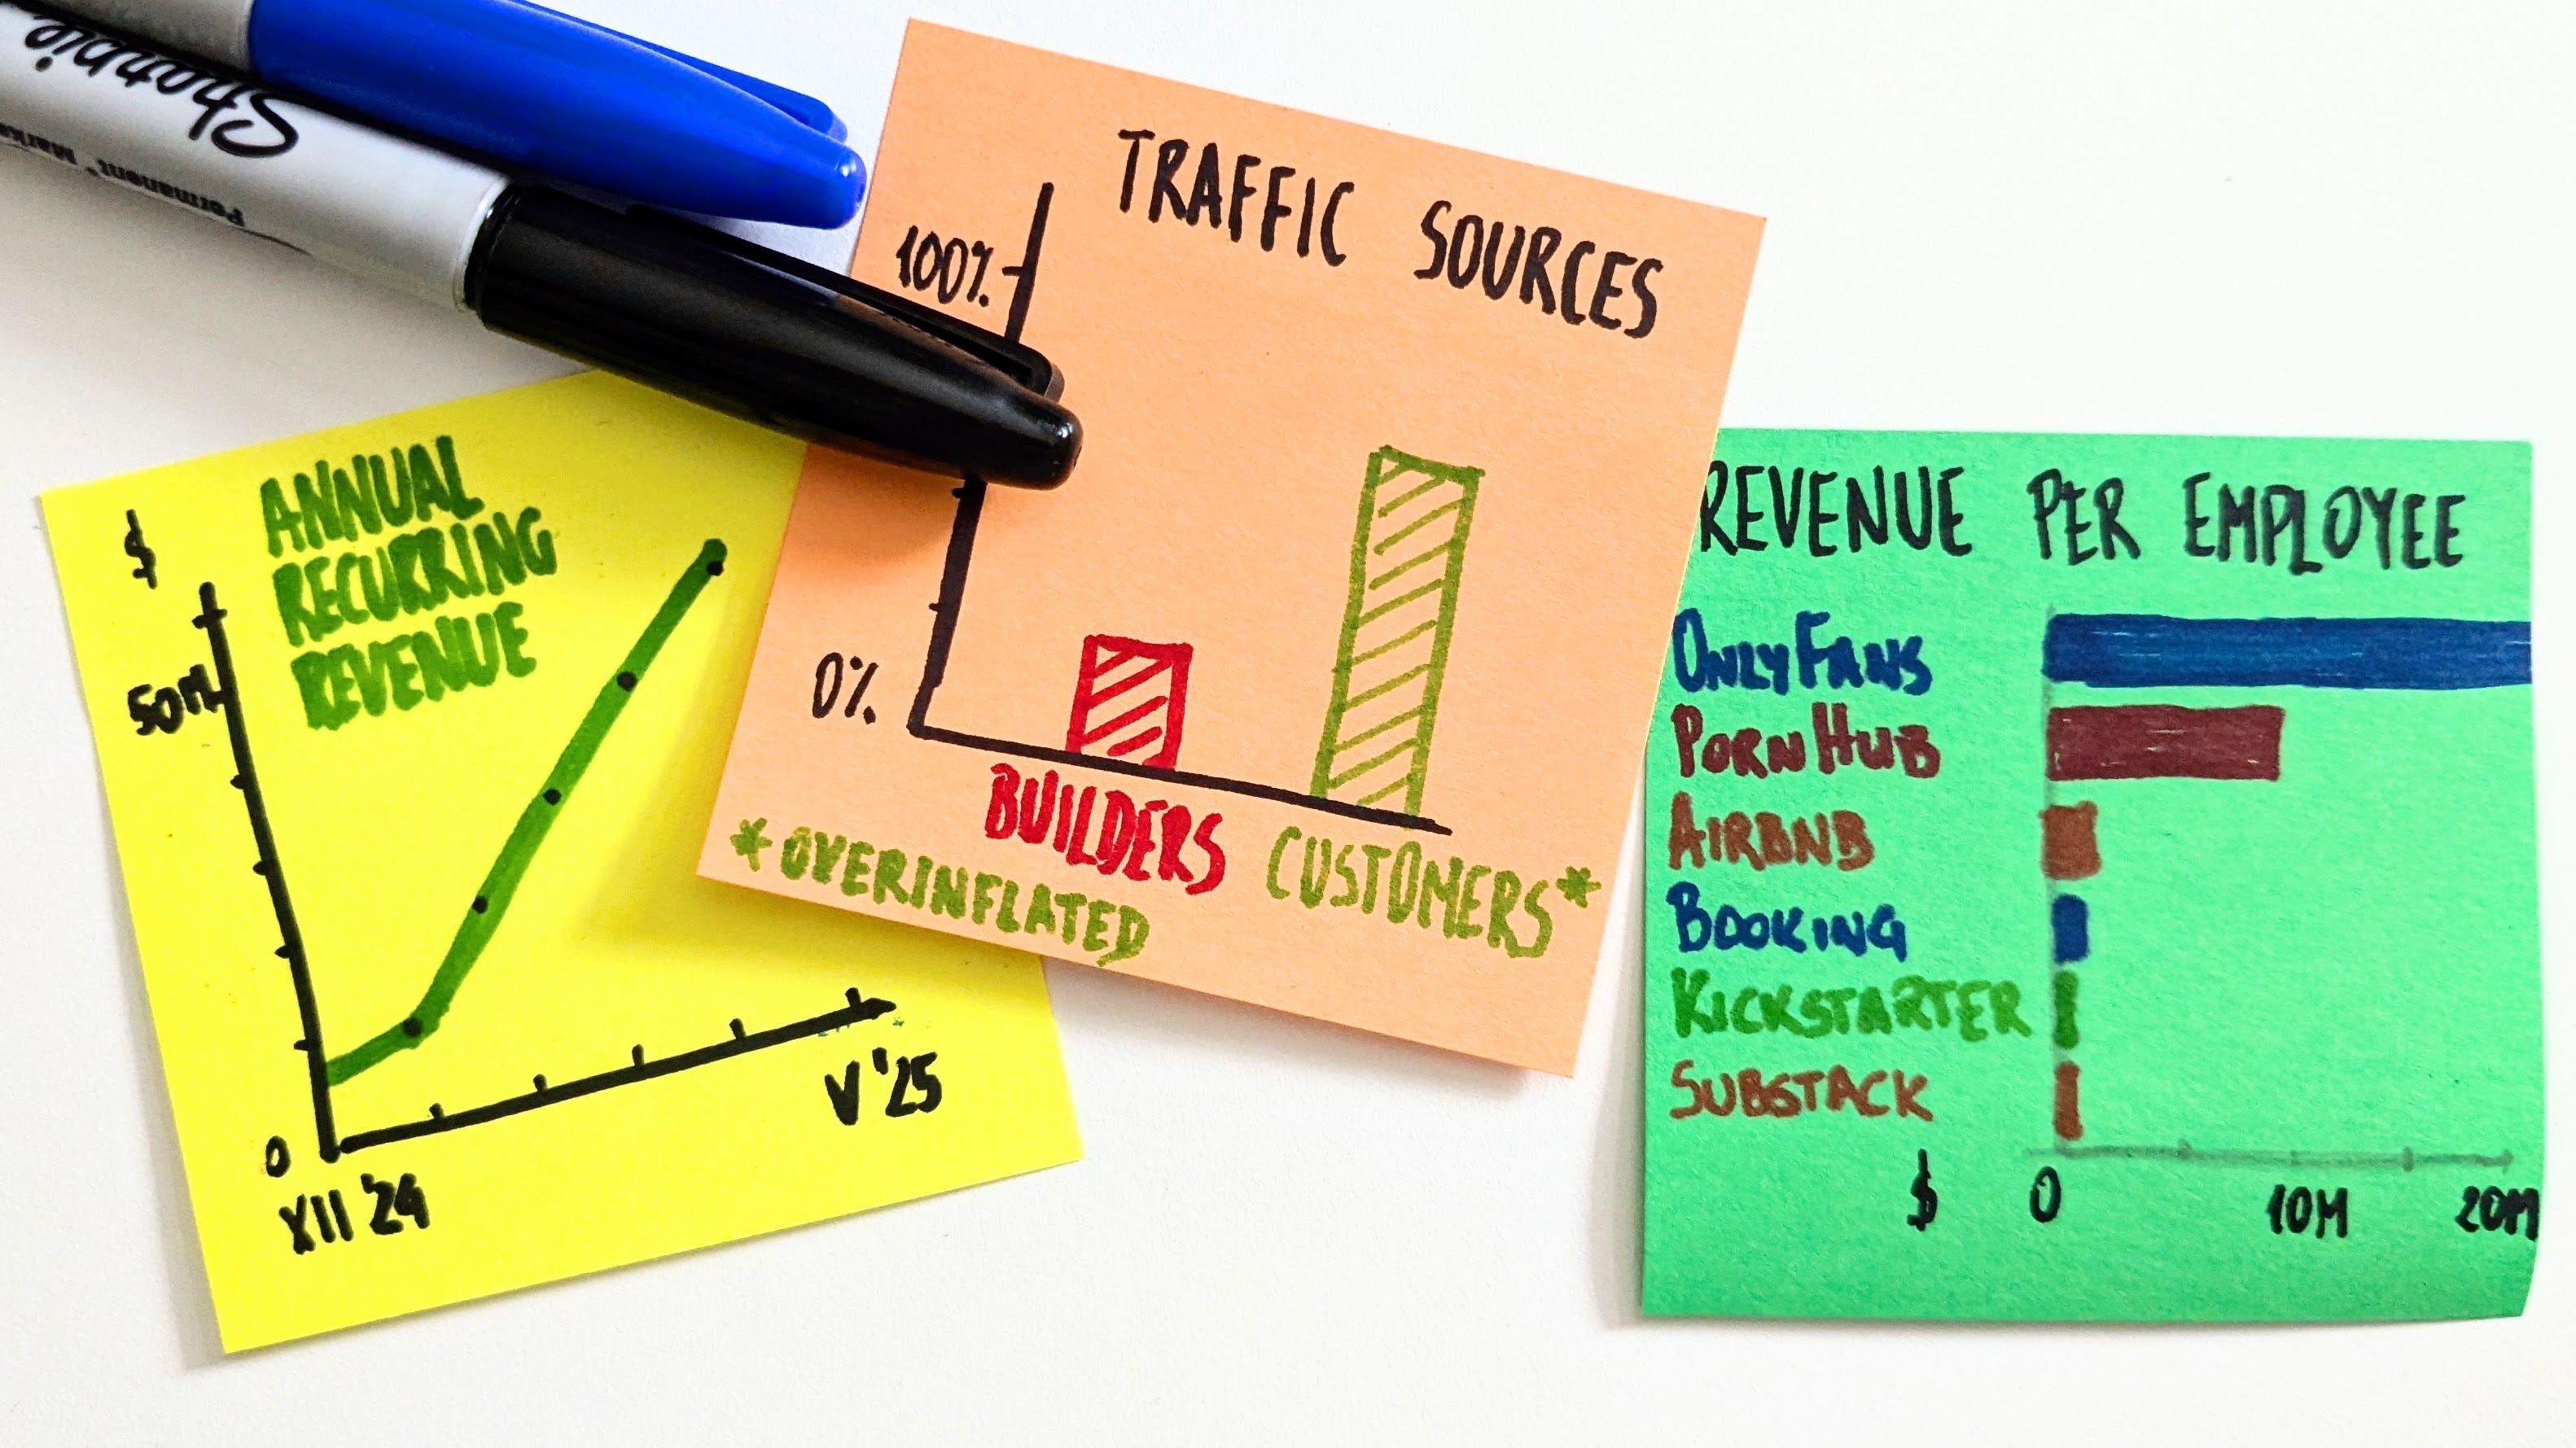
One obviously "good" metric in the Lean Startup world would be Annual Recurring Revenue (ARR). It checks all the boxes.
It's about revenues.
It's recurring, thus suggesting customers' long-term commitment to using the product
It measures the very last step of the funnel, dodging typical vanity metrics land altogether
If we want to discuss ARR, there's no better case than Lovable. The most recent darling of the startup and AI industries alike, it's a tool that allows you to translate prompts in plain English to working, deployed software.
The interesting part of the story is not Lovable's bold pursuit of the Holy Grail of software development—generating working software with no coding skills. After all, Replit does the same thing.
What gathers widespread attention is how quickly Lovable grows.
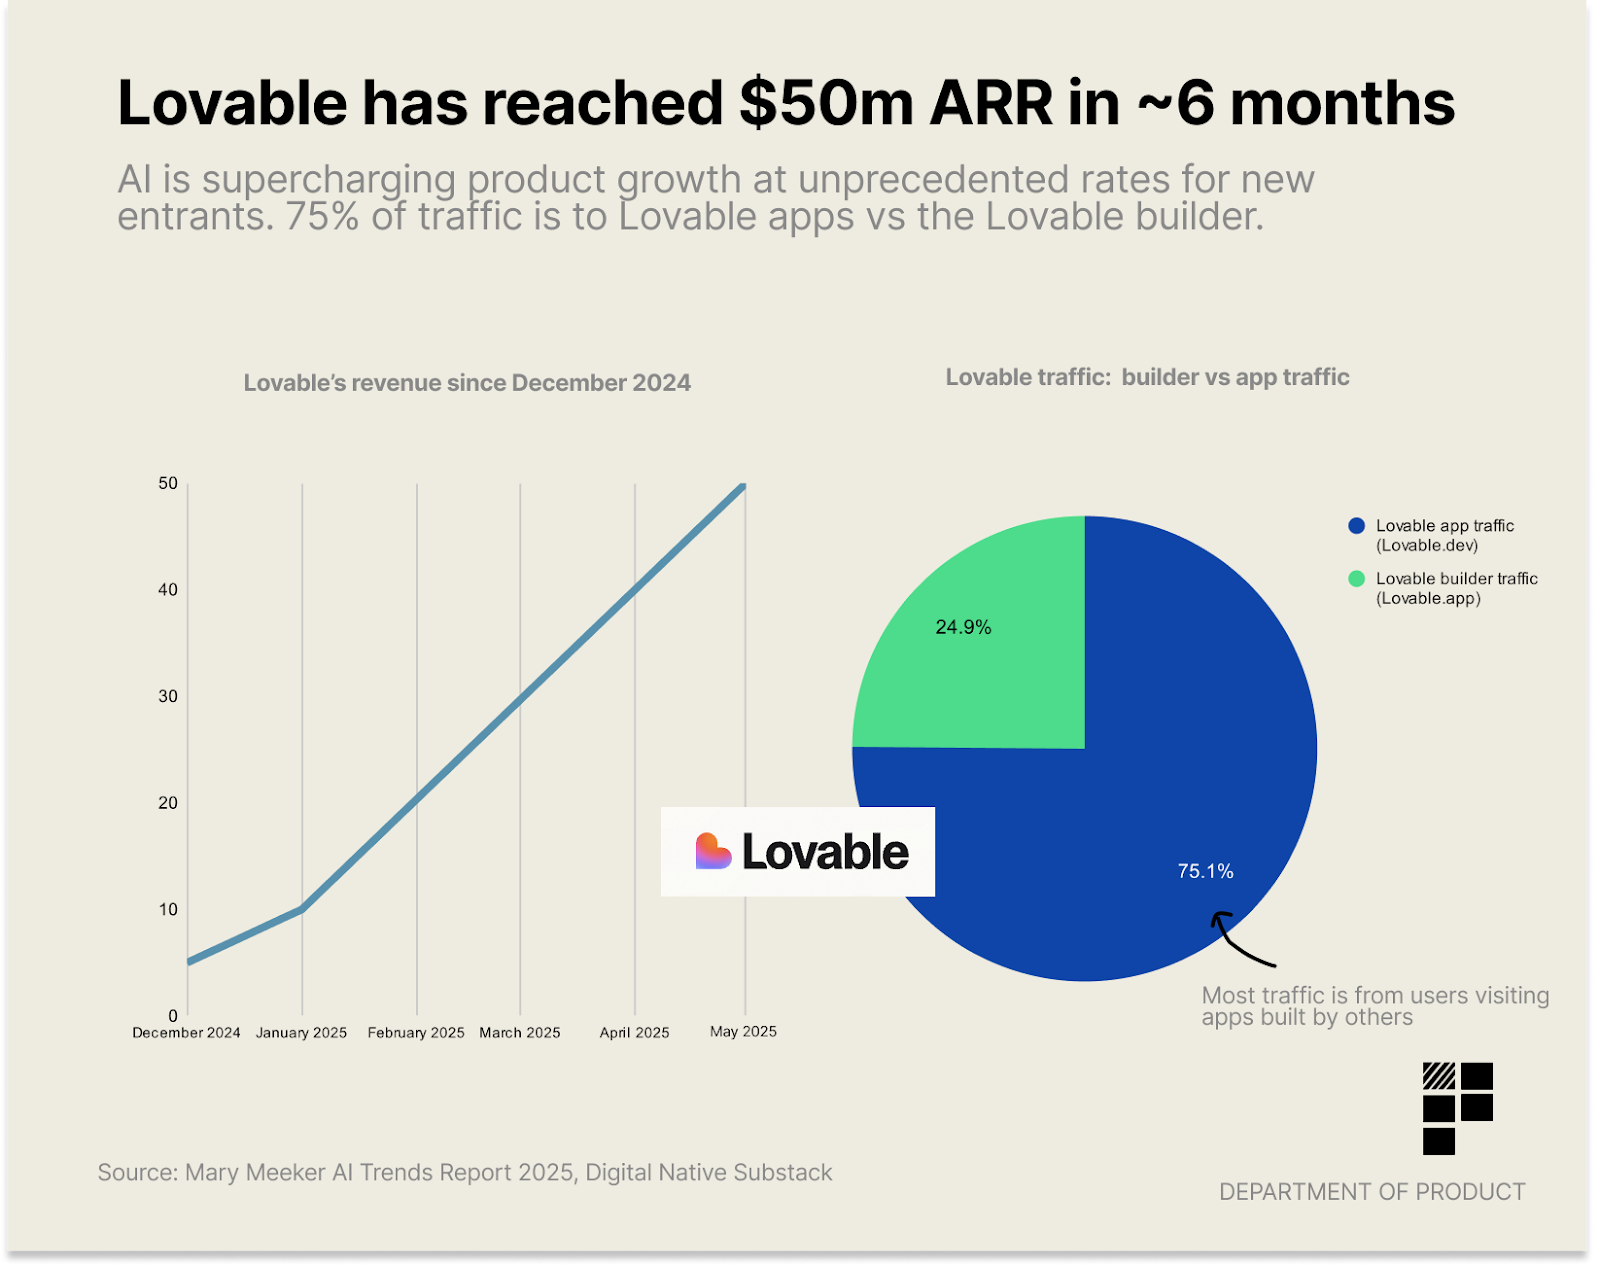
They're basically adding $10M of ARR each month. Should they keep this pace, they may become the fastest-growing startup ever.
No wonder everybody loves Lovable (pun intended).
Pageviews Strike Back
I really like the chart above, for it shows a much more insightful bit than ARR growth. It proudly announces that, by now, 75% of the total traffic comes from deployed apps, not the builder.
If you're not familiar with the tool, the builder is where you prompt the model to generate an app for you. You can test it there, but it's not available to anyone else just yet. Once you deploy the app, everyone can access it, most notably the potential customers of the products built with Lovable.
Does it mean that three-fourths of the traffic comes from the customers of the websites created with Lovable? Not really. When I run my Lovable test, due to integration with another tool, I had to test a deployed app. Aside from prompting, I didn’t spend any time in the builder.
While I generated a decent number of pageviews for my “product,” none of them came from customers of any sort.
The real customer usage will then be lower than what the data suggests at its face value. How much lower? I don't have a way to tell, but I'd guess "significantly" is the word to describe it.
But why does it matter?
What Lovable's Traffic Means
Let's optimistically assume that all 75% of Lovable's traffic came from the customers. For each pageview coming from an aspiring product builder, there would be 3 from the users.
Let's then play with this data using the example of Google search.
All employees of the core search team (approximately 1,000 people) would likely generate several thousand pageviews a day. Multiply it by 3, and we'd get 50k pageviews a day from the customers.
That's about as many as there are queries in 300 milliseconds on average.
I know the comparison I used is unfair. I used the example of the most popular website on the internet. However, I could have used any validated big-time product, and the verdict, while not as stunning, would have been the same.
3 clicks from customers for each developer's click is nothing to write home about. If anything, I'd rather hide this fact well.
In fact, there are no internet businesses that could survive with such a ratio. None. Nil. Zilch.
What follows, unless the traffic numbers become fundamentally different, we can safely assume that whoever uses Lovable does that as a play, not a serious business.
Which, in turn, raises questions about the long-term sustainability of the revenues.
While ARR looks great now, it might be a colossus with feet of clay.
Capital Efficiency
Another highly valued metric similar to ARR is revenue per employee, typically measured as ARR per employee.
It shows capital usage efficiency. If a company goes lean and can generate significant revenues, it's a clear signal of low investment risk. After all, it should be quick to start generating profits.
Lovable, in fact, is a shining star on that account, too. With reported 30 employees, they'd be well ahead of $1M ARR per person. Color me impressed.
Although it’s not even close to OnlyFans.
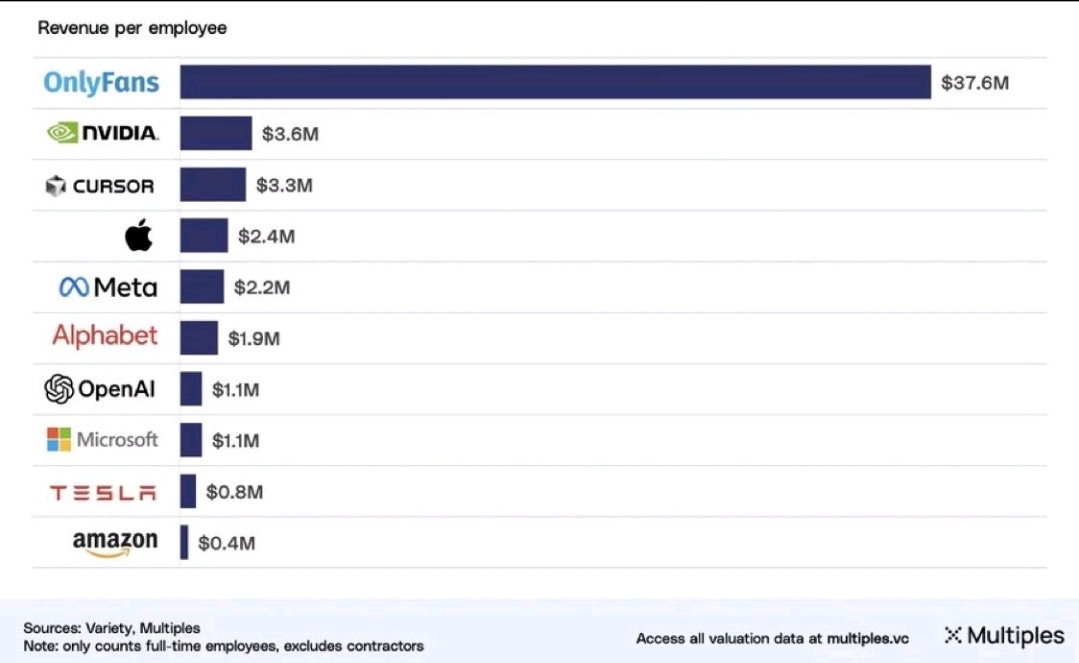
It seems when it comes to revenues per employee, OnlyFans beats everyone's butts, no sweat.
I have a problem with this chart, though.
Revenues per Employee in Context
The businesses compared in the chart are very different from one another. We have:
Physical goods manufacturers (Tesla, Apple)
Digital behemoths getting a swath of their revenues from ads (Google, Facebook)
Physical retail corporation (Walmart)
A digital equivalent of the above (Amazon) that runs physical-work-heavy warehouses
Marketplace making its cut from transactions between creators and consumers (OnlyFans)
and more
The potential leverage per employee varies significantly in each scenario. There are labor-heavy and labor-light cases. There are physical goods and digital services. It's really comparing apples to oranges.
What's even more crucial, translating revenues to profits would differ wildly between these businesses. After all, the chart tells us nothing about the costs.
To accurately assess OnlyFans' ARR per employee, we should instead pick Kickstarter, Booking.com, Airbnb, or Substack as relevant data points.
Interestingly, all these businesses fare pretty well against such a measuring stick. Granted, OnlyFans would still look just as exceptional as it does on the original chart.
So, should we compare it to companies with a different business model but the same niche?
While PornHub's numbers are not publicly available, whatever bits we can find would put it in second place on the list, trailing only OnlyFans and well ahead of the rest of the pack.
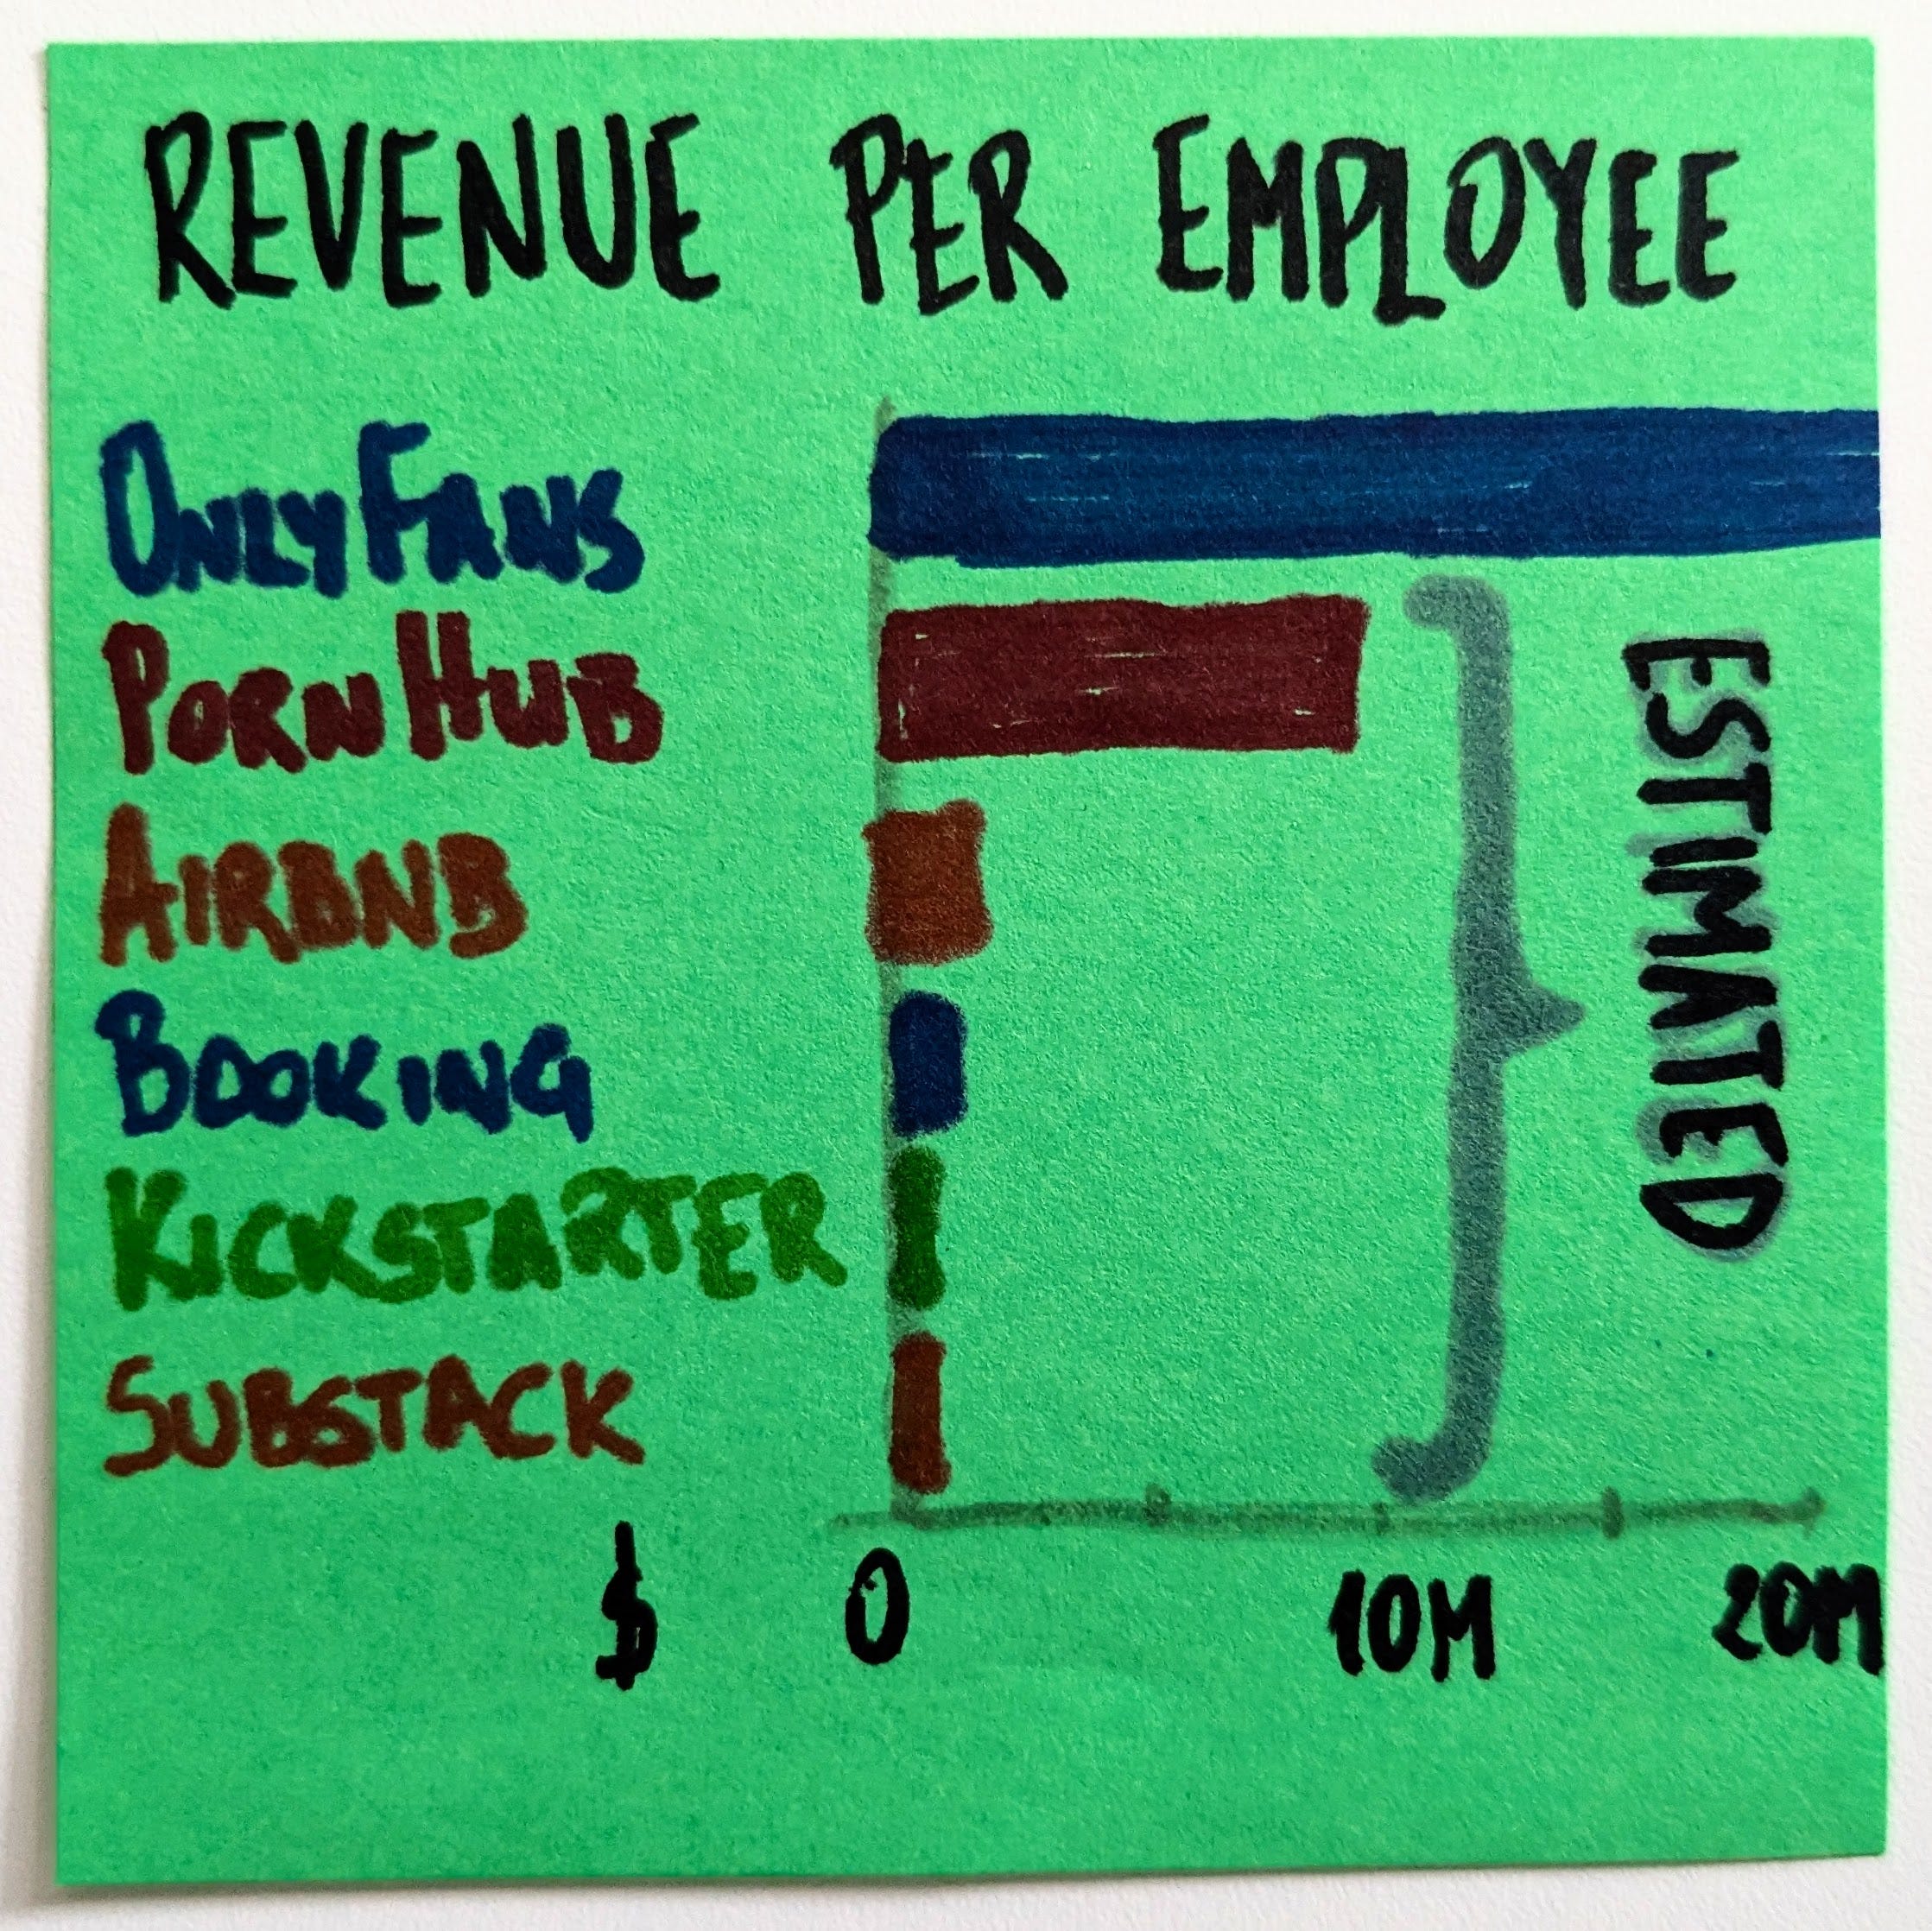
If there's a lesson to learn here, it's "do porn," I guess.
Or, again, it is the lesson about (mis)using metrics.
Can Revenues Be Vanity?
While any revenue-related metric is better than pageviews or sign-ups, we still need context to determine its usefulness.
In Lovable's case, against common enchantment, I remain skeptical. Its current technical capabilities limit the applicability of vibe-coded apps heavily, eliminating it as an option for an overwhelming majority of potential product ideas.
While I am positively in awe when I see how much Lovable can do, it's not nearly enough to build a sustainable business with it. In my book, this puts the reliability of revenues and the likelihood of sustained growth at risk.
What's more, we know nothing about the cost of their infrastructure. We know they ride on several LLMs, and it doesn't come for free.
Lovable's ARR and ARR per employee look rosy, but they work somewhat like vanity metrics.
The Elephant in the Room
To make things worse, if we check the list of Lovable's AI vendors, none of them is profitable themselves. To get there, they may need to ramp up the prices. Suddenly, the P&L of their heavy users—including Lovable—may start looking much redder.
That's, by the way, the elephant in the room. The entire AI infrastructure is currently subsidized.
Everyone seems to believe that there will be very few survivors once the dust settles, so we, the users, get fantastic features for free (or nearly so). Just look at Google pushing Gemini down everyone's throat, from search, through docs, to email.
However, once we know the winners, the bills will necessarily go up.
But even now, large-scale usage comes at a price. So, while a typical 2020 digital business might have largely ignored its infrastructure costs and focused only on the labor costs, 5 years later, a business utilizing AI capabilities cannot.
That changes the usefulness of metrics such as revenue per employee. How much? We don't yet know.
Case for Supporting Metrics
When it comes to the metrics, the 2000s were the heyday of traffic. Google, Facebook, YouTube, and Twitter each sought to attract as many users as they could. Revenues? That was supposed to be figured out later. Somehow.
And it was, indeed.
Google paved the way for the highest-traffic websites to evolve into advertising powerhouses, reinventing the ad industry in the process. The rest have followed suit.
Optimizing for traffic worked. Or did it?
For the very few companies that have won the competition, it might have worked. For tens of thousands of others, it was a race to oblivion. Without dominating their part of the market, traffic meant close to nothing.
Thus, we turned to more actionable metrics, such as revenues. We could assess the long-term health of the business by combining its popularity (traffic) and how much it could squeeze out of that (revenues).
Interestingly, traffic, although potentially monetizable, comes at a cost. We need to maintain sufficient infrastructure to handle the increased demand and scale the product as more people use it.
Traffic and revenues are mutually supporting metrics. Without traffic, it may be hard to monetize anything, but it's far from enough. In turn, once we secure revenues, traffic dynamics may tell us how sustainable these revenues are.
Vanity Metrics 2.0
That observation brings me back to Lovable. They ride an absolutely fabulous wave of revenue dynamics. I am concerned about its sustainability, though.
Whatever they share about the traffic is at least concerning. And anything related to profitability, which would be a better supporting metric, is unavailable.
I think we can generalize that observation. We live in a world where:
Many products rely on quickly evolving infrastructure
The long-term cost of which is yet unknown
The very infrastructure makes the competition much more capable of catching up
And the whole thing is heavily hyped
In this world, revenues—and revenues per employee, especially—become increasingly just another version of a vanity metric.
We need a new set of metrics that focuses on sustainability and profitability.
Sure, we'll ride the wave of revenues being the Holy Grail for quite some more time. VCs, after all, don't change that fast, and it's them who set expectations as to what we should measure.
It took a decade or more to move away from treating traffic alone as a single good health-o-meter of an internet business.
It will take some time for ARR to find its place, too. And it won't be nearly as prominent as it is right now.
Is Profitability the New Black?
An obvious question to ask is: If revenues aren't that good of an indicator of a company's health, then what is?
My hip-shot answer would be profitability. Ideally, net profit.
It's a compound metric that takes all the considerations enumerated above under one umbrella.
Can it be gamed, though? Sure! That's what so many short-term corporate CEOs are doing to maximize shareholders' returns. However, the longer term we consider, the less leeway we have to game the system.
And if AI's promise of building (reliable) digital products much faster and much cheaper will materialize, it means that the path to profitability might be much shorter.
No need to wait long years till we are in the black. No need for tens or hundreds of millions of investments.
Interestingly, it might mean a renaissance of bootstrapping. But that post already got long, and that's another story.